In this section, we report results from VDM Monte Carlo simulation
with 32 pairs of protons and electrons in the temperature and density
range of ![]() K
K
![]() K and
K and
![]() .
Particle configurations are generated by sequencing over all particles,
giving the particle a uniform displacement, computing the new density
matrix from Eqs. 3.19 and 3.13, and accepting or rejecting
the new configuration by the Metropolis algorithm. This is completely
analogous to the usual Monte Carlo ground state variational
calculations except for the additional work of determining the variational
parameters based on the proposed configuration.
.
Particle configurations are generated by sequencing over all particles,
giving the particle a uniform displacement, computing the new density
matrix from Eqs. 3.19 and 3.13, and accepting or rejecting
the new configuration by the Metropolis algorithm. This is completely
analogous to the usual Monte Carlo ground state variational
calculations except for the additional work of determining the variational
parameters based on the proposed configuration.
Although the Gaussian ansatz VDM will be seen to provide a reasonable model for hydrogen over the full density and temperature regime, the main purpose in presenting these results is to serve as a base for documenting future improvements from better VDMs and the application to PIMC.
|
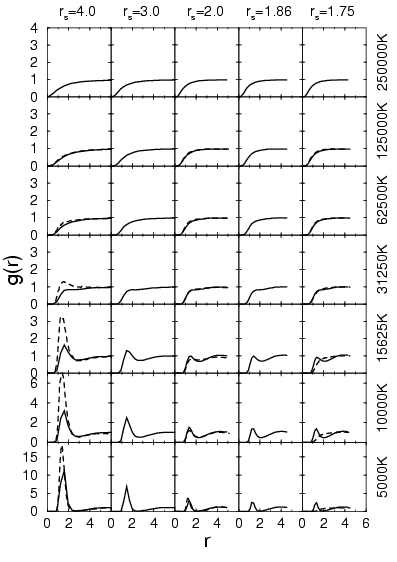
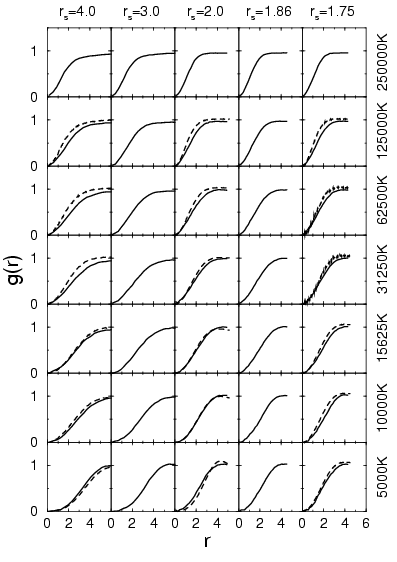
The proton-proton pair correlation functions are shown in
Fig. 3.6. For temperatures below ![]() K, a peak emerges
near
K, a peak emerges
near ![]() that demonstrates clearly the formation of molecules. The
comparison with PIMC simulations (Militzer and Ceperley, 2000; Magro et al., 1996) at low density
shows that the peak positions agree well but PIMC predicts a
significantly bigger height indicating a larger number of
molecules. This could be explained by the missing correlations in the
VDM ansatz.
that demonstrates clearly the formation of molecules. The
comparison with PIMC simulations (Militzer and Ceperley, 2000; Magro et al., 1996) at low density
shows that the peak positions agree well but PIMC predicts a
significantly bigger height indicating a larger number of
molecules. This could be explained by the missing correlations in the
VDM ansatz.
At a density of ![]() , proton-proton pair correlation functions
from PIMC and VDM are almost identical. If the peak is sufficiently
separated from the remaining curve, the area under the peak multiplied
by the density gives an estimate for the molecular fraction. By
comparing the estimate for different densities at
, proton-proton pair correlation functions
from PIMC and VDM are almost identical. If the peak is sufficiently
separated from the remaining curve, the area under the peak multiplied
by the density gives an estimate for the molecular fraction. By
comparing the estimate for different densities at ![]() K, one finds
that the molecular fraction is diminished when the density is lowered
below that corresponding to
K, one finds
that the molecular fraction is diminished when the density is lowered
below that corresponding to ![]() . This effect is well-known and
is a result of the increased entropy of dissociated molecules, which
leads to complete dissociation and ionization in the low density limit
at non-zero temperatures.
. This effect is well-known and
is a result of the increased entropy of dissociated molecules, which
leads to complete dissociation and ionization in the low density limit
at non-zero temperatures.
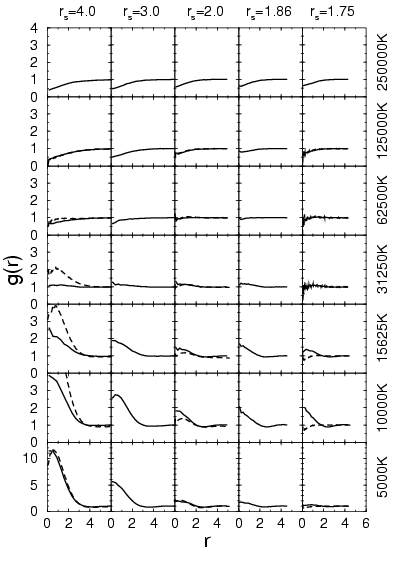
Considerable differences between the proton-proton pair correlation
functions are found at ![]() below
below ![]() where VDM shows
a fair number of molecules while PIMC predicts a metallic fluid
where all bonds are broken as a result of pressure dissociation
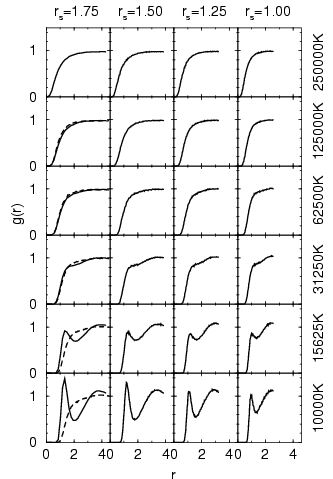
(Militzer et al., 1999; Magro et al., 1996). This effect has to be verified by PIMC simulations
with VDM nodes because free particle nodes could enhance the
transition to a metallic state. Proton-proton pair correlation
functions from additional VDM simulations for
where VDM shows
a fair number of molecules while PIMC predicts a metallic fluid
where all bonds are broken as a result of pressure dissociation
(Militzer et al., 1999; Magro et al., 1996). This effect has to be verified by PIMC simulations
with VDM nodes because free particle nodes could enhance the
transition to a metallic state. Proton-proton pair correlation
functions from additional VDM simulations for
![]() are shown in figure 3.7. The VDM method exhibits a
smooth transition from a molecular to a atomic structure, in which the
molecular binding is gradually reduced with increasing density.
are shown in figure 3.7. The VDM method exhibits a
smooth transition from a molecular to a atomic structure, in which the
molecular binding is gradually reduced with increasing density.
The position of the peak of the proton-proton pair correlation
functions shifts from ![]() at the lowest density, corresponding to
at the lowest density, corresponding to
![]() , to
, to ![]() at
at ![]() . The same trend has been found in
the PIMC simulations (Magro et al., 1996) but the opposite was reported in
(Galli et al., 2000; Rescigno, 1999).
. The same trend has been found in
the PIMC simulations (Magro et al., 1996) but the opposite was reported in
(Galli et al., 2000; Rescigno, 1999).
|
|
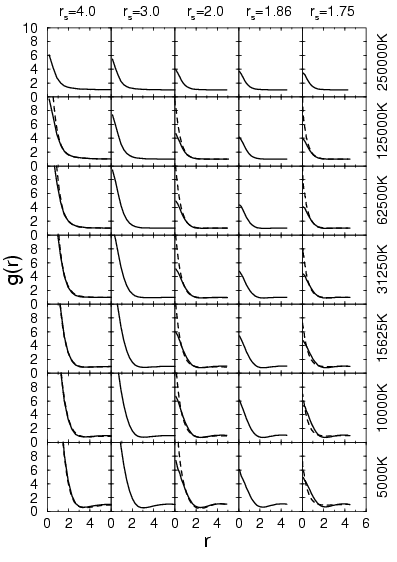
In the proton-electron pair correlation functions shown in
Fig. 3.8, one finds a strong attraction present even at high
temperatures such as ![]() K. At low temperatures, the
electrons are bound in atoms and molecules. This pair correlation
function does not show a clear distinction between the two cases.
From studying the height of the peak at the origin multiplied by the
density, one can make comparisons of the number of bound electrons at
low temperature. Similar to the molecular fraction, one finds a
reduction of bound electrons with decreasing density below that
corresponding to
K. At low temperatures, the
electrons are bound in atoms and molecules. This pair correlation
function does not show a clear distinction between the two cases.
From studying the height of the peak at the origin multiplied by the
density, one can make comparisons of the number of bound electrons at
low temperature. Similar to the molecular fraction, one finds a
reduction of bound electrons with decreasing density below that
corresponding to ![]() . The comparison with PIMC shows that VDM
underestimates the height of the peak. This is probably a result of
the Gaussian ansatz, which does not satisfy the cusp condition at the
proton.
. The comparison with PIMC shows that VDM
underestimates the height of the peak. This is probably a result of
the Gaussian ansatz, which does not satisfy the cusp condition at the
proton.
|
|
Fig. 3.9 shows the effect of the Pauli exclusion principle leading to a strong repulsion for electrons in the same spin state. This effect is not present in the interaction of electrons with anti-parallel spin displayed in Fig. 3.10. There one observes the effect of the Coulomb repulsion at high temperature. At low temperature, one finds a peak at the origin as a result of the formation of molecules, in which two electrons of opposite spin are localized along the bond. The differences from the PIMC graphs can be interpreted as a consequence of the different molecular fractions observed in Fig. 3.6.

|
The average squared width ![]() of the Gaussian is shown in
Fig. 3.11 as a function temperature and density. At high
temperature and low density, one finds only small deviations from the
free particle limit. These become more significant with increasing
density and decreasing temperature. At low temperature, the attraction
to the protons dominates, which leads to a decreasing average
width. Finally bound states form and the width approaches a finite
limit. At low densities, this is close to the ground state squared
width of the isolated molecule,
of the Gaussian is shown in
Fig. 3.11 as a function temperature and density. At high
temperature and low density, one finds only small deviations from the
free particle limit. These become more significant with increasing
density and decreasing temperature. At low temperature, the attraction
to the protons dominates, which leads to a decreasing average
width. Finally bound states form and the width approaches a finite
limit. At low densities, this is close to the ground state squared
width of the isolated molecule, ![]() . It should be noted that in the
limit of very high density, one expects the Gaussians orbitals to be
almost as delocalized as the free particle solution because the
Coulomb interaction is then a correction to the dominating kinetic
terms. This limit does not seem to be represented correctly in this
VDM ansatz. The current VDM orbital are too localized in the limit of
high density. We interpret this as an effect of the insufficiently
accurate treatment of the exchange terms described in section
3.7. In particular,
one would need to include corrections to the norm matrix, which where
left out because of the drastic increase in the numerical requirements.
. It should be noted that in the
limit of very high density, one expects the Gaussians orbitals to be
almost as delocalized as the free particle solution because the
Coulomb interaction is then a correction to the dominating kinetic
terms. This limit does not seem to be represented correctly in this
VDM ansatz. The current VDM orbital are too localized in the limit of
high density. We interpret this as an effect of the insufficiently
accurate treatment of the exchange terms described in section
3.7. In particular,
one would need to include corrections to the norm matrix, which where
left out because of the drastic increase in the numerical requirements.
|
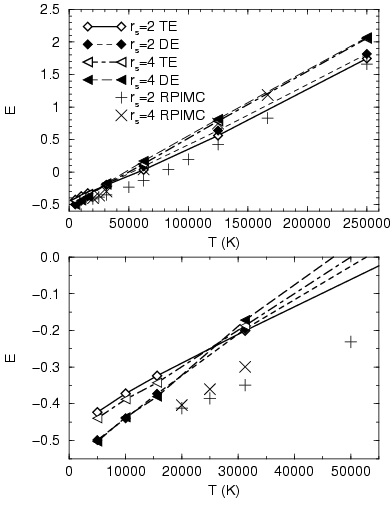
In Fig. 3.12, we compare the internal energy from the thermodynamic estimator in Eq. 3.50 and the direct estimator in Eq. 3.49. Both agree fairly well at low density. Differences build up with increasing density and decreasing temperature. Comparing with PIMC simulations, one finds that the VDM energies are generally too high. The magnitude of this discrepancy shows the same density and temperature dependence as the difference between the two VDM estimators. The difference from the PIMC results could be explained by the missing correlation effects in the VDM method.
At high temperature, the thermodynamic estimator always gives lower
energies than the direct estimator. Below ![]() K, the ordering
is reversed. This is consistent with the results from the isolated
atom and molecule. The consequence is that the direct estimator is
actually closer to the value expected from PIMC simulations. However,
it should be noted that this estimator is not thermodynamically
consistent (see section 3.5.2).
K, the ordering
is reversed. This is consistent with the results from the isolated
atom and molecule. The consequence is that the direct estimator is
actually closer to the value expected from PIMC simulations. However,
it should be noted that this estimator is not thermodynamically
consistent (see section 3.5.2).
|
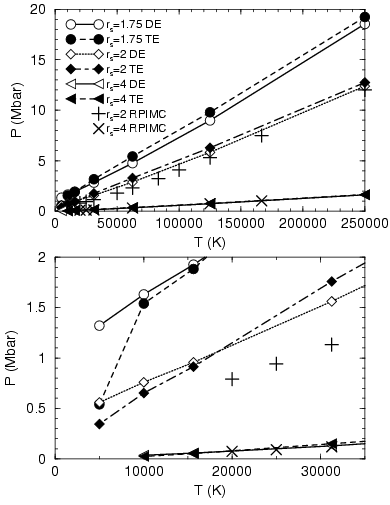
In Fig. 3.13, we compare pressure as a function of temperature
and density from the two VDM estimators with PIMC results. At low
density, the agreement is remarkably good. With increasing density and
decreasing temperature, the difference grows. For densities over
![]() below
below ![]() K, one finds a significant drop in the
direct estimator for the pressure. We interpret this effect as a
result of the thermodynamic inconsistency.
K, one finds a significant drop in the
direct estimator for the pressure. We interpret this effect as a
result of the thermodynamic inconsistency.
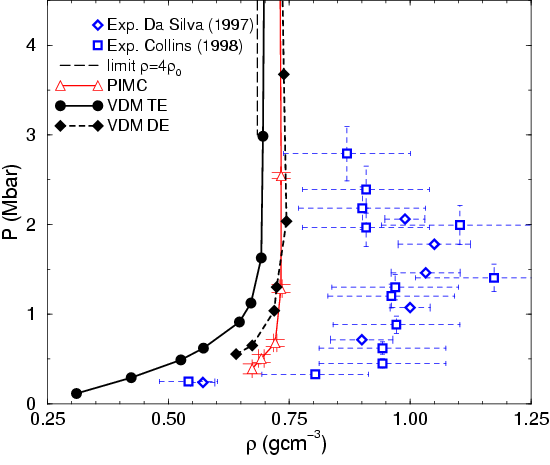
Fig. 3.14, compares the Hugoniot from laser shock wave
experiments (Da Silva, 1997; Collins et al., 1998) with VDM and PIMC results. VDM direct
estimator (DE, full diamonds, Eq. 3.49) and VDM
thermodynamic estimator (TE, full circles,
Eq. 3.50-3.52)). The long dashed line indicates the
theoretical high pressure limit ![]() of the fully
dissociated non-interacting plasma. In the experiments, a shock wave
propagates through a sample of precompressed liquid deuterium
characterized by its initial state, (
of the fully
dissociated non-interacting plasma. In the experiments, a shock wave
propagates through a sample of precompressed liquid deuterium
characterized by its initial state, (![]() ,
,
![]() ,
, ![]() ).
Assuming an ideal shock front, the variables of the shocked material
(
).
Assuming an ideal shock front, the variables of the shocked material
(![]() ,
,
![]() ,
, ![]() ) satisfy the Hugoniot relation (Zeldovich and Raizer, 1966) (see
section
) satisfy the Hugoniot relation (Zeldovich and Raizer, 1966) (see
section ![[*]](crossref.png) for details),
for details),
| (191) |
We expect the difference of the two estimators to give a rough
estimate of the accuracy of the VDM approach. At high temperature, the
difference is relatively small and agreement with PIMC simulations is
reasonable. Both VDM estimators indicate that there is maximal
compressibility around 1.5 Mbar. Furthermore, significant deviations
are found from the experiments except for may be the lowest pressure
point of
![]() . However, in this regime of high density and
relatively low temperature a more careful study seems unavoidable. In
section , we give a more detailed
discussion on the Hugoniot that include predictions from other method
and results from PIMC simulations using the VDM nodal surface to
restrict the paths.
. However, in this regime of high density and
relatively low temperature a more careful study seems unavoidable. In
section , we give a more detailed
discussion on the Hugoniot that include predictions from other method
and results from PIMC simulations using the VDM nodal surface to
restrict the paths.