|
The pair density matrices are calculated using the matrix squaring
method described in section 2.3.1. They
are stored in tables using the expansion formula Eq. 2.38 and
then entered into the PIMC simulation program. The accuracy of these
tables is crucial for all following results. Using the precomputed
pair density matrices allows one to employ a much larger time step
because one starts with a solution of the two-particle
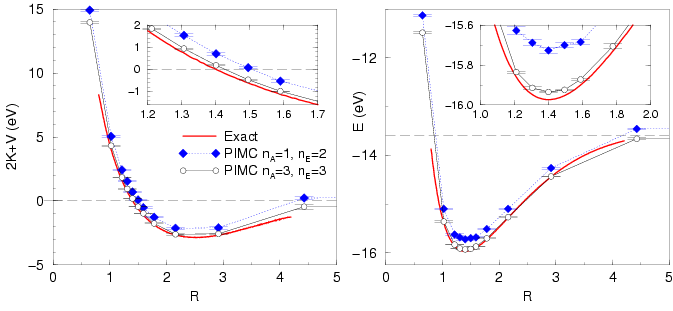
problem. Fig. ![[*]](crossref.png) shows how accurate this method
is. The internal energy of an isolated hydrogen atom at sufficiently
temperature (
shows how accurate this method
is. The internal energy of an isolated hydrogen atom at sufficiently
temperature (
![]() ) in a large box (
) in a large box (![]() ) is compared
with the exact groundstate energy of
) is compared
with the exact groundstate energy of ![]() . The temperature
was chosen low enough so that excited states can be neglected e.g. the
contribution to the energy from the occupation of first excited state
is
. The temperature
was chosen low enough so that excited states can be neglected e.g. the
contribution to the energy from the occupation of first excited state
is
![]() at this temperature. Furthermore, it is
tested whether the kinetic energy
at this temperature. Furthermore, it is
tested whether the kinetic energy ![]() and the potential energy
and the potential energy ![]() satisfy the virial theorem
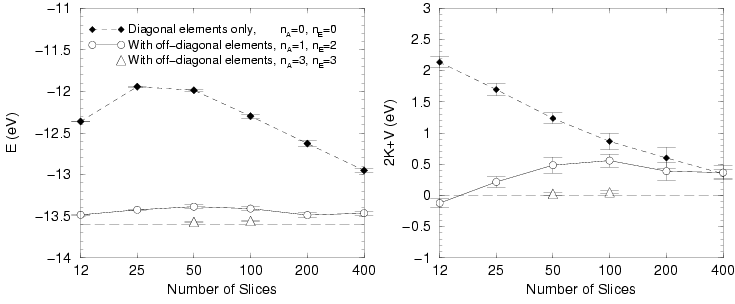
satisfy the virial theorem ![]() . If only diagonal action terms are
considered in Eq. 2.38 one finds a rather slow convergence as
function of the number of time slices
(Fig. ). Eventually, the error goes to zero in
the Trotter limit, Eq. 2.24, of an infinite number of
slices. Using off-diagonal terms in the expansion formula,
Eq. 2.38, improves the convergence significantly as shown in
Fig. . One can use different orders to
calculate the action
. If only diagonal action terms are
considered in Eq. 2.38 one finds a rather slow convergence as
function of the number of time slices
(Fig. ). Eventually, the error goes to zero in
the Trotter limit, Eq. 2.24, of an infinite number of
slices. Using off-diagonal terms in the expansion formula,
Eq. 2.38, improves the convergence significantly as shown in
Fig. . One can use different orders to
calculate the action ![]() and the energy
and the energy ![]() . The resulting
accuracy from different orders is shown in
Tabs. and . It reveals
that using order 2 or higher instead of order 1 in the action
decreases the errors by almost one order of magnitude. This is an
important observation because most many-particle simulations reported
in this work had been performed with
. The resulting
accuracy from different orders is shown in
Tabs. and . It reveals
that using order 2 or higher instead of order 1 in the action
decreases the errors by almost one order of magnitude. This is an
important observation because most many-particle simulations reported
in this work had been performed with ![]() and
and ![]() (which
was found to be sufficient for simulations of Helium particles) before
this analysis was done. Because of the resulting inaccuracies, the
estimated energies and pressures are slightly too high.
(which
was found to be sufficient for simulations of Helium particles) before
this analysis was done. Because of the resulting inaccuracies, the
estimated energies and pressures are slightly too high.
|
|
|
|||||||
| energy | action order | action order | ||||||
| order | 0 | 1 | 2 | 3 | 0 | 1 | 2 | 3 |
| 0 | 0.8(1) | 1.74(3) | ||||||
| 1 | 0.47(2) | -0.18(3) | -0.071(25) | -0.176(08) | 0.074(11) | 0.043(07) | ||
| 2 | 0.56(2) | -0.07(3) | 0.013(48) | -0.166(05) | 0.063(09) | 0.034(13) | ||
| 3 | 0.61(4) | -0.06(3) | 0.039(08) | -0.183(11) | 0.056(11) | 0.031(03) | ||
|
|
|
|||||||
| energy | action order | action order | ||||||
| order | 0 | 1 | 2 | 3 | 0 | 1 | 2 | 3 |
| 0 | 1.24(7) | 1.991(28) | ||||||
| 1 | 0.46(4) | -0.12(5) | -0.074(12) | 0.033(12) | ||||
| 2 | 0.51(4) | -0.07(2) | -0.067(13) | 0.044(07) | ||||
| 3 | 0.03(2) | 0.036(7) | ||||||
|
|
|
|||||
|
|
|
|||||
|
|
0.5 | 1 | 2 | 0.5 | 1 | 2 |
| 7812 | 0.41(3) | 0.16(3) | -0.06(8) | -0.422(10) | -0.112(8) | 0.030(22) |
| 3906 | 0.41(3) | 0.19(3) | 0.14(4) | -0.419(07) | -0.110(5) | -0.008(11) |
| 1953 | 0.43(3) | 0.16(2) | 0.08(3) | -0.421(12) | -0.115(9) | -0.009(09) |
|
| (198) |
, the exact results by Kolos and Wolniewicz (1964)
for
The accuracy of PIMC simulations of an isolated molecule is affected
by the order in action and energy expansion as well as by the time
step because it is a four-particle problem. Tab.
shows results calculated with
![]() orders. First, we
studied the different temperatures and found no dependence on
orders. First, we
studied the different temperatures and found no dependence on ![]() ,
which means that contributions from electronic excited states are
negligible. Furthermore, the comparison of different time steps shows
a significant dependence. Using a time step
,
which means that contributions from electronic excited states are
negligible. Furthermore, the comparison of different time steps shows
a significant dependence. Using a time step
![]() allows one to calculate the energy with an accuracy of
approximately
allows one to calculate the energy with an accuracy of
approximately ![]() eV and
eV and ![]() with an error of about
with an error of about ![]() eV
per atom. Using a smaller time step would bring the results in
Fig. closer to the exact results.
eV
per atom. Using a smaller time step would bring the results in
Fig. closer to the exact results.
Most many-particle PIMC simulations discussed in the following
sections have been performed using ![]() and
and ![]() in the
action and energy expansion of the pair density matrices. The correction
resulting from higher order terms will be estimated based on the
following argument. Higher order off-diagonal terms are large for
small separations of the two particles. Therefore, we expected the
dominant corrections to come from pairs of protons and electron when
both particles are close together. Therefore, we suggest to use the integral of
the proton-electron pair correlation function up to a cut-off radius,
in the
action and energy expansion of the pair density matrices. The correction
resulting from higher order terms will be estimated based on the
following argument. Higher order off-diagonal terms are large for
small separations of the two particles. Therefore, we expected the
dominant corrections to come from pairs of protons and electron when
both particles are close together. Therefore, we suggest to use the integral of
the proton-electron pair correlation function up to a cut-off radius,
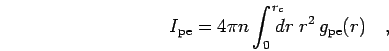 |
(199) |
. The effect is significantly
smaller than the differences in energy and pressure, which are
relevant in this context.
