|
|
|
We used PIMC simulations with 32 protons and 32 electrons, a time step
![]() K,
K, ![]() , and
, and ![]() to generate the phase
diagram shown in Fig.
to generate the phase
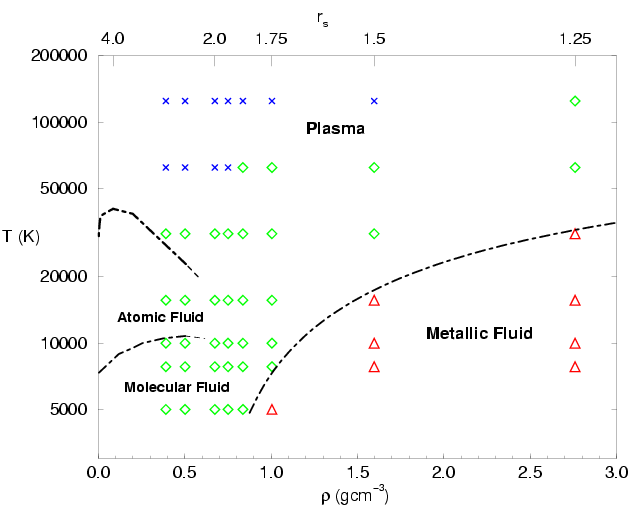
diagram shown in Fig. ![[*]](crossref.png) . In the low density and
low temperature regime, we find a molecular fluid. In the
proton-proton pair correlation functions (see section ,
Fig. ), one finds a clear peak at the bond length
of
. In the low density and
low temperature regime, we find a molecular fluid. In the
proton-proton pair correlation functions (see section ,
Fig. ), one finds a clear peak at the bond length
of ![]() . The integral under the peak is proportional to the number of
molecules. This criterion works well for low densities where the peak
is well separated from the remaining contributions. Alternatively, one
can estimate the number of molecules as well as other compound
particles by a cluster analysis, in which the individual path
configurations from PIMC simulations are analyzed. As described in
(Militzer et al., 1998), we consider two protons as belonging to one cluster if
they are less than 1
. The integral under the peak is proportional to the number of
molecules. This criterion works well for low densities where the peak
is well separated from the remaining contributions. Alternatively, one
can estimate the number of molecules as well as other compound
particles by a cluster analysis, in which the individual path
configurations from PIMC simulations are analyzed. As described in
(Militzer et al., 1998), we consider two protons as belonging to one cluster if
they are less than 1![]() apart. An electron belongs to one
particular cluster if it is less than 0.75
apart. An electron belongs to one
particular cluster if it is less than 0.75![]() away from any
proton in the cluster. The two cut-off radii were chosen from the
molecular and atomic ground state distribution. This analysis give
reasonable estimates for the molecular and atomic fractions at low
temperatures. At high temperature, it typically overestimated the
number of bound states because in a collision, two particles are close
but this is not a bound state. We corrected for this artifact by
applying an additional criterion. A particle can only be considered as
bound if the difference in action (or energy) to remove it from the
cluster is positive. This method leads to the expected corrections at
high temperature. The regime boundaries in Fig.
are hardly affected. Summarizing one can say that PIMC simulations
provide good estimates for the number of atoms and molecules at low
density but a rigorous quantum-mechanical definition of what a bound
state is and how to identify it remains to be given. Several ideas are
discussed in the work by Girardeau (1990).
away from any
proton in the cluster. The two cut-off radii were chosen from the
molecular and atomic ground state distribution. This analysis give
reasonable estimates for the molecular and atomic fractions at low
temperatures. At high temperature, it typically overestimated the
number of bound states because in a collision, two particles are close
but this is not a bound state. We corrected for this artifact by
applying an additional criterion. A particle can only be considered as
bound if the difference in action (or energy) to remove it from the
cluster is positive. This method leads to the expected corrections at
high temperature. The regime boundaries in Fig.
are hardly affected. Summarizing one can say that PIMC simulations
provide good estimates for the number of atoms and molecules at low
density but a rigorous quantum-mechanical definition of what a bound
state is and how to identify it remains to be given. Several ideas are
discussed in the work by Girardeau (1990).
Starting in the molecular regime, one finds that increasing temperature at constant density leads to the gradual process of thermal dissociation of molecules, which results into a regime with a majority of atoms. The atoms are then gradually ionized at even higher temperatures leading to a plasma of free protons and electrons. Lowering the density at constant temperature leads to a decrease in the number of molecules, or atoms respectively. We call these processes entropy dissociation of molecules and entropy ionization of atoms because both processes are driven by the increased entropy of the unbound states due to the larger volume.
If the density is increased at constant temperature, pressure
dissociation diminishes the molecular fraction. This transition was
described by Magro et al. (1996). In simulations with the time step
![]() , it was found that the number of molecules
drops significantly within a small density interval. Secondly, a
region with
, it was found that the number of molecules
drops significantly within a small density interval. Secondly, a
region with
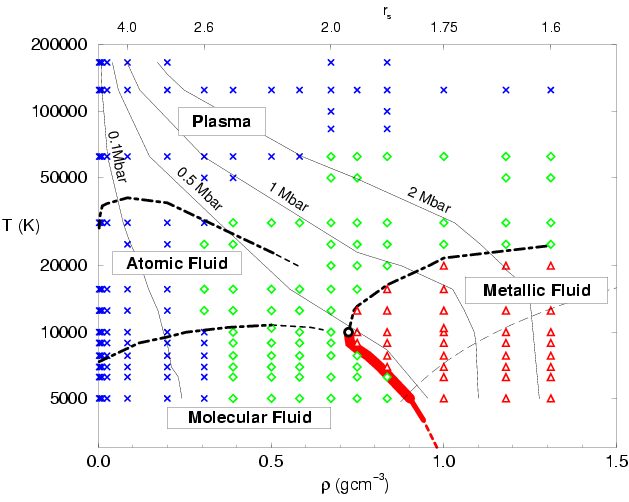
![]() was
found as shown in Fig. . Both results are consistent
with a first order plasma phase transition (PPT). In this case, one
expects to find a coexistence region indicated by thick red line in
Fig. , which ends in a critical point.
was
found as shown in Fig. . Both results are consistent
with a first order plasma phase transition (PPT). In this case, one
expects to find a coexistence region indicated by thick red line in
Fig. , which ends in a critical point.
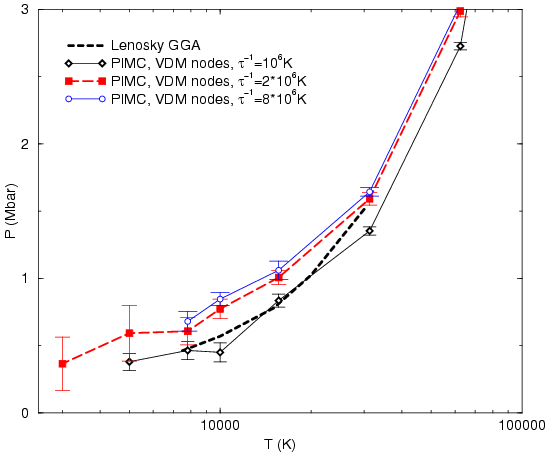
Since the work by Magro et al. (1996), we were able to obtain simulation
results with better convergence, smaller time steps, for larger systems
and different nodal surfaces. It should be emphasized that the type of
nodal surface has a significant effect on the thermodynamic properties in
the region of the PPT, which will be discussed in detail in
section .
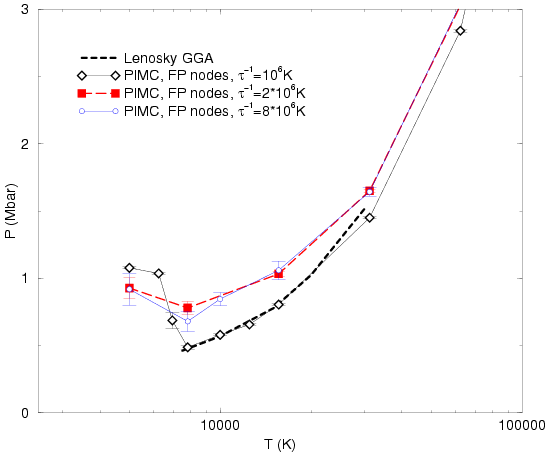
First, we verified that simulations using free particle nodes and
smaller time steps (
![]() and
and
![]() ,
,
![]() )
also predict
)
also predict
![]() as shown
in Fig. . Using a smaller time step makes the pressure
drop less pronounced but it can still be clearly identified.
as shown
in Fig. . Using a smaller time step makes the pressure
drop less pronounced but it can still be clearly identified.
![\includegraphics[angle=0,width=14cm]{figures4/H024_4.small.ps}](h024.png) |
![\includegraphics[angle=0,width=14cm]{figures4/D023_1.small.ps}](D023.jpg) |
![\includegraphics[angle=0,width=14cm]{figures4/D159_1.small.ps}](D159.gif) |
![\includegraphics[angle=0,width=13cm]{figures4/all.P1_12.eps}](img854.png) |
As a next step, we looked at the number of permuting electrons,
which is one of the key properties to
understand this transition. We determined the fraction of electrons
involved in a permutation as an indication of electronic
delocalization. Permuting electrons are required to form a Fermi
surface (see
chapter 5), which
means that a high number of permutations indicates a high degree of
degeneracy of the electrons. If, in average, over 80% of the
electrons are involved in a permutation we label this state
metallic. Permuting electrons form long chains of paths and therefore
occupy delocalized states. This delocalization destabilizes the
hydrogen molecules. Before all bonds are broken, one finds a
molecular fluid with some permuting electrons as visualized in
Fig. . It still shows a significant molecular
signature but differs from the molecular fluid at lower density in
Fig. by the increased fraction of permuting
electrons. If the density is increased further, the majority of the
electron become delocalized, all bonds are broken, which leads to a
metallic fluid of unbound proton and the degenerate electron gas as
shown in Fig. .
Fig. shows histograms of the number of permuting
electrons. At low density, the permutation probability is small and
the peak in the histogram is on the left. The peak position shifts to
the right with increasing density indicating the higher fraction of
permuting electrons. Eventually, one finds a sharp peak near 1,
which corresponds to degenerate electronic states where almost all
electrons permute. The histogram also provides information on how this
transition occurs in simulations with free particle nodes. Near the
critical density, we found that the simulation exhibits a switching
behavior between a less degenerate (and presumably more molecular) and
highly degenerate (with unbound protons) state. The bimodal distribution
can be seen best in the simulation at ![]() and
and ![]() K in
Fig. and to a lesser extent for
K in
Fig. and to a lesser extent for ![]() and
and
![]() K as well as for
K as well as for ![]() K. This switching behavior
indicates that the transition occurs as a collective effect, which
is required for a first order phase transition.
K. This switching behavior
indicates that the transition occurs as a collective effect, which
is required for a first order phase transition.
The boundaries of the metallic regime in Fig.
are determined by two effects. With increasing temperature, the degree
of degeneracy of the electrons is reduced and one finds a
gradual transition to a less degenerate plasma state. If the temperature
is lowered, the attraction to the protons becomes more relevant, which
localizes the electrons and decreases the degree of degeneracy as also
can be seen in Fig. .