| (1) |
 |
(3) |
|
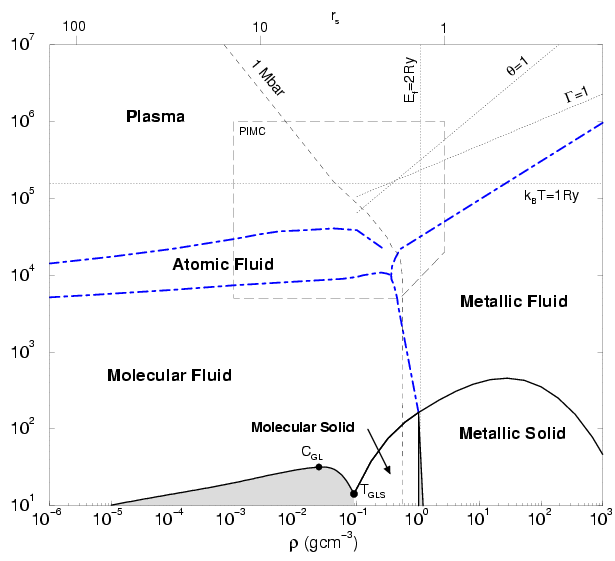
The hydrogen phase diagram Fig. 1.1 was
designed to show the various regimes of hydrogen and discuss the
principle physical effects. It should be noted that several regions
are not yet well understood e.g. how the high temperature results at
5000 K connect up to the room temperature regime. We used our
estimates from PIMC simulations and extrapolated into different
directions. In our approach, we do not consider relativistic effects,
which become important when the thermal energy or the Fermi energy become
of the order of the rest mass energy of the electron, which
corresponds to a temperatures of
![]() and a density of
and a density of
![]() .
.
In the low density and low temperature region of the phase diagram,
hydrogen is composed of neutral species. Molecules dominate at low
temperature (
![]() ), which dissociate into atoms with
increasing temperature. If the temperature is increased further atoms
become gradually ionized and a plasma of unbound electrons and protons
is generated. Above the temperature corresponding to the binding
energy of 1 Ry (
), which dissociate into atoms with
increasing temperature. If the temperature is increased further atoms
become gradually ionized and a plasma of unbound electrons and protons
is generated. Above the temperature corresponding to the binding
energy of 1 Ry (
![]() ) the probability for the occupation
of bound states goes to zero.
) the probability for the occupation
of bound states goes to zero.
Similarly in the limit of very high density, bound states cannot exist
because the degeneracy effects dominate. There, delocalized states
have a smaller energy than an antisymmetric combination of bound
orbitals. This regime is expect to prevail when the Fermi energies
become of the order 1 Ry. However, it should noted this
represents a extremely simplified calculation and that the precise value
probably lies significantly over ![]() . In the high-density
limit, the electrons also form a rigid background and hydrogen behaves
like a one-component plasma of ions with neutralizing
background. In the phase diagram, we label this state as metallic
fluid because the electrons behave like a degenerate Fermi gas and the
estimated conductivity is high. The degeneracy also distinguishes this
regime from the plasma state. We observed a continuous transition between
the two regimes.
. In the high-density
limit, the electrons also form a rigid background and hydrogen behaves
like a one-component plasma of ions with neutralizing
background. In the phase diagram, we label this state as metallic
fluid because the electrons behave like a degenerate Fermi gas and the
estimated conductivity is high. The degeneracy also distinguishes this
regime from the plasma state. We observed a continuous transition between
the two regimes.
In the phase diagram, the region of PIMC simulations from this work
combined with earlier ones by Pierleoni et al. (1994) and Magro et al. (1996) has been
indicated. The region is of particular interest because there hydrogen
is characterized by strong coupling, a substantial degree of
degeneracy, but also by the formation of atom and molecules. It is
very difficult to design a chemical model (see
section 1.4) that includes all of the
mentioned effects in a reliable approximation. In particular the
interaction of neutral species with charged particles has been proven
to be rather complicated. The advantage of the PIMC technique is that
it is a quantum-statistical method, which includes all the mentioned
effects just by considering protons and electrons interacting via the
Coulomb potential. The method is exact except for requiring a nodal
surface in order to deal with the fermion sign problem. In this
work, we will derive a variational density matrix (VDM) that allows us
to replace free particle nodes by a density matrix that includes
interactions and bound states. It was found that the type of nodes
begin to have a noticeable effect on the derived thermodynamic
quantities for
![]() .
.
Furthermore, there are also some practical limitations that put a
limit on the applicability of the PIMC method in its current
implementation, which originate from the available computational
resources. For example, it has been proven to be difficult to go below
temperatures of 5000 K because this would require paths with more 200
time slices in order to describe the formation of molecules
accurately. Also the fermion nodes can reduce the efficiency for very
high values of the degeneracy. Currently we are able to study hydrogen
for
![]() . For very low density, the MC efficiency is reduced
because particles rarely collide. This is also the case for
PIMC but this limit has not been reached for
. For very low density, the MC efficiency is reduced
because particles rarely collide. This is also the case for
PIMC but this limit has not been reached for ![]() . The reason why
we have not performed simulations at higher temperature or lower
density is that analytical models are expected to work very well in the
regime of weak coupling.
. The reason why
we have not performed simulations at higher temperature or lower
density is that analytical models are expected to work very well in the
regime of weak coupling.
The phase diagram also shows a region where the four discussed regimes: molecular, atomic, metallic fluid and plasma meet approximately. The region continues to be controversial. Many models have predicted a first-order plasma phase transition (PPT) with critical point and coexistence region of two fluids characterized by different degrees of ionization and densities. This existence of a PPT was first mentioned in a phase diagram by Landau and Zeldovich (1943). First calculations have been made by Norman and Starostin (1968) and Ebeling and Sändig (1973). Since then the research community has been divided. A number of different free energy models such as those by (Saumon and Chabrier, 1992; Kitamura and Ichimaru, 1998; Beule et al., 1999) predict a PPT. The exact location of the critical point and the coexistence region differ considerably. Other models show continuous transitions (Ross, 1998).
Also in the PIMC work by Magro et al. (1996), a first order phase transition between the molecular to a metallic phase was predicted. These predictions will be critically reviewed in this work. It will be discussed what effect the free particle nodes and the time step have on the nature of the transition.
The gas-liquid coexistence regime with the critical point
and gas-liquid-solid triple point were taken from the work by
Kitamura and Ichimaru (1998). The first order phase transition from molecular
to metallic hydrogen was calculated by
Ceperley and Alder (1987). From the work by Ceperley and Alder (1980) it is known that
the Wigner crystal of electrons melts at ![]() . Similarly any
solid structure of protons must become unstable if the proton
parameter
. Similarly any
solid structure of protons must become unstable if the proton
parameter
![]() reaches 100. That is the reason why
the melting line of the metallic solid must decrease with temperature
in the limit of high density.
reaches 100. That is the reason why
the melting line of the metallic solid must decrease with temperature
in the limit of high density.
Furthermore, it should noted that there exist different molecular
phases in solid hydrogen at about 1 Mbar (
![]() ), which
have been studied intensely using diamond anvil cell experiments
(Silvera and Pravica, 1998; Mao and Hemley, 1994) as well as with various simulation methods
(Surh et al., 1997; Cui et al., 1997; Kitamura et al., 2000). The phases are labelled I, II and III and
correspond to different orderings of the molecules in the
crystal. Phase I is characterized by free rotation of the molecules
represented by an angular momentum state
), which
have been studied intensely using diamond anvil cell experiments
(Silvera and Pravica, 1998; Mao and Hemley, 1994) as well as with various simulation methods
(Surh et al., 1997; Cui et al., 1997; Kitamura et al., 2000). The phases are labelled I, II and III and
correspond to different orderings of the molecules in the
crystal. Phase I is characterized by free rotation of the molecules
represented by an angular momentum state ![]() . In Phase III, the
rotational degree of freedom are frozen in and one refers to it as a
state of classical orientational ordering. Phase II is believed to be
distinguished by the ordering angular momentum states.
. In Phase III, the
rotational degree of freedom are frozen in and one refers to it as a
state of classical orientational ordering. Phase II is believed to be
distinguished by the ordering angular momentum states.